[1]:
import pandas as pd
import numpy as np
import time
import normet
import matplotlib.pyplot as plt
import matplotlib
from pylab import savefig
[2]:
df=pd.read_csv(r'data/MY1.csv',parse_dates=['date'],index_col='date')
[3]:
df
[3]:
| O3 | NO | NO2 | NOXasNO2 | SO2 | CO | PM10 | NV10 | V10 | PM2.5 | ... | AP10 | AT2.5 | AP2.5 | site | code | latitude | longitude | location_type | Ox | NOx | |
|---|---|---|---|---|---|---|---|---|---|---|---|---|---|---|---|---|---|---|---|---|---|
| date | |||||||||||||||||||||
| 2020-01-01 00:00:00 | 1.72961 | 78.38595 | 45.77784 | 165.96796 | 4.75424 | NaN | 69.0 | 60.0 | 9.0 | 58.1 | ... | 1026.2 | 4.7 | 1025.2 | London Marylebone Road | MY1 | 51.52253 | -0.154611 | Urban Traffic | 23.960024 | 83.832703 |
| 2020-01-01 01:00:00 | 1.92918 | 88.61587 | 52.64325 | 188.51903 | 4.84394 | 0.397528 | 45.0 | 38.4 | 6.6 | 43.2 | ... | 1026.2 | 4.6 | 1024.1 | London Marylebone Road | MY1 | 51.52253 | -0.154611 | Urban Traffic | 27.524407 | 95.223555 |
| 2020-01-01 02:00:00 | 1.99570 | 70.02935 | 44.76870 | 152.14554 | 3.09474 | 0.346417 | 46.2 | 39.1 | 7.1 | 43.0 | ... | 1026.2 | 4.9 | 1024.1 | London Marylebone Road | MY1 | 51.52253 | -0.154611 | Urban Traffic | 23.579103 | 76.850791 |
| 2020-01-01 03:00:00 | 2.04559 | 67.58589 | 40.20699 | 143.83725 | 2.96019 | 0.335059 | 45.1 | 38.8 | 6.3 | 42.8 | ... | 1026.2 | 4.6 | 1024.1 | London Marylebone Road | MY1 | 51.52253 | -0.154611 | Urban Traffic | 21.299094 | 72.654172 |
| 2020-01-01 04:00:00 | 2.99355 | 72.03298 | 47.26010 | 157.70912 | 3.83478 | 0.349257 | 40.8 | 34.2 | 6.6 | 36.8 | ... | 1026.2 | 4.2 | 1024.1 | London Marylebone Road | MY1 | 51.52253 | -0.154611 | Urban Traffic | 25.320553 | 79.661030 |
| ... | ... | ... | ... | ... | ... | ... | ... | ... | ... | ... | ... | ... | ... | ... | ... | ... | ... | ... | ... | ... | ... |
| 2020-12-31 19:00:00 | 20.70539 | 12.46950 | 30.47461 | 49.59424 | 1.12164 | 0.129904 | 13.9 | 11.8 | 2.1 | 11.7 | ... | 1002.9 | -0.1 | 1001.9 | London Marylebone Road | MY1 | 51.52253 | -0.154611 | Urban Traffic | 25.415693 | 25.050618 |
| 2020-12-31 20:00:00 | 24.14797 | 9.65279 | 26.51175 | 41.31249 | 1.12164 | 0.094180 | 14.6 | 11.3 | 3.3 | 11.0 | ... | 1002.9 | 0.6 | 1001.9 | London Marylebone Road | MY1 | 51.52253 | -0.154611 | Urban Traffic | 25.080442 | 20.867401 |
| 2020-12-31 21:00:00 | 25.69464 | 12.46950 | 28.45232 | 47.57196 | 1.36199 | 0.087685 | 16.6 | 13.0 | 3.6 | 15.3 | ... | 1003.9 | 0.8 | 1001.9 | London Marylebone Road | MY1 | 51.52253 | -0.154611 | Urban Traffic | 26.809326 | 24.029142 |
| 2020-12-31 22:00:00 | 26.39313 | 6.45629 | 25.05721 | 34.95672 | 0.88129 | 0.084437 | 19.1 | 16.0 | 3.1 | 17.1 | ... | 1003.9 | 0.3 | 1002.9 | London Marylebone Road | MY1 | 51.52253 | -0.154611 | Urban Traffic | 25.432539 | 17.657011 |
| 2020-12-31 23:00:00 | 27.93980 | 6.61453 | 22.07004 | 32.21218 | 0.88129 | 0.087685 | 17.6 | 13.2 | 4.4 | 15.2 | ... | 1003.9 | 0.3 | 1002.9 | London Marylebone Road | MY1 | 51.52253 | -0.154611 | Urban Traffic | 24.672379 | 16.270723 |
6373 rows × 53 columns
[4]:
era=pd.read_csv(r'data/MY1_era.csv',parse_dates=['date'],index_col='date')
[5]:
era
[5]:
| u10 | v10 | d2m | t2m | blh | sp | ssrd | tcc | tp | rh2m | lat | lon | |
|---|---|---|---|---|---|---|---|---|---|---|---|---|
| date | ||||||||||||
| 2020-01-01 00:00:00 | -2.720528 | 1.545010 | 277.183465 | 278.394725 | 384.209053 | 102252.303312 | -1.164153e-10 | 0.650958 | 0.000008 | 91.884130 | 51.52253 | -0.154611 |
| 2020-01-01 01:00:00 | -2.308789 | 1.282742 | 276.695430 | 277.772899 | 353.220263 | 102211.168636 | -1.164153e-10 | 0.603699 | 0.000002 | 92.715877 | 51.52253 | -0.154611 |
| 2020-01-01 02:00:00 | -2.216471 | 0.758730 | 276.505662 | 277.463419 | 255.911846 | 102174.855967 | -1.164153e-10 | 0.710378 | 0.000005 | 93.485560 | 51.52253 | -0.154611 |
| 2020-01-01 03:00:00 | -1.928623 | 0.509013 | 276.412816 | 277.305813 | 191.375560 | 102166.786485 | -1.164153e-10 | 0.837765 | 0.000005 | 93.906363 | 51.52253 | -0.154611 |
| 2020-01-01 04:00:00 | -1.700043 | 0.607069 | 276.553051 | 277.478941 | 151.780210 | 102142.578039 | -1.164153e-10 | 0.819103 | 0.000003 | 93.696878 | 51.52253 | -0.154611 |
| ... | ... | ... | ... | ... | ... | ... | ... | ... | ... | ... | ... | ... |
| 2020-12-31 19:00:00 | 1.380939 | -1.945195 | 272.197565 | 273.557442 | 476.945688 | 99902.506413 | -5.820766e-11 | 0.918149 | 0.000000 | 90.582979 | 51.52253 | -0.154611 |
| 2020-12-31 20:00:00 | 0.987925 | -2.102732 | 272.171041 | 273.629146 | 486.665851 | 99947.625909 | -5.820766e-11 | 0.839639 | 0.000000 | 89.939908 | 51.52253 | -0.154611 |
| 2020-12-31 21:00:00 | 0.681543 | -1.933668 | 272.087408 | 273.470592 | 489.355002 | 100000.215520 | -5.820766e-11 | 0.739354 | 0.000000 | 90.422188 | 51.52253 | -0.154611 |
| 2020-12-31 22:00:00 | 1.020793 | -0.583816 | 272.235319 | 272.926062 | 40.714872 | 100042.844978 | -5.820766e-11 | 0.643753 | 0.000000 | 95.088677 | 51.52253 | -0.154611 |
| 2020-12-31 23:00:00 | 0.959517 | -0.377511 | 272.020979 | 272.681367 | 55.617254 | 100053.601944 | -5.820766e-11 | 0.549403 | 0.000000 | 95.290673 | 51.52253 | -0.154611 |
8784 rows × 12 columns
[6]:
df1=pd.concat([df,era],axis=1)
AutoML-based weather normalisation
[7]:
df1a=normet.prepare_data(df1, value='PM2.5', feature_names=['u10', 'v10', 'd2m', 't2m',
       'blh', 'sp', 'ssrd', 'tcc', 'tp', 'rh2m'], split_method='random',  fraction=0.75, seed=7654321)
[8]:
automl=normet.train_model(df1a,variables=['u10', 'v10', 'd2m', 't2m',
       'blh', 'sp', 'ssrd', 'tcc', 'tp', 'rh2m','date_unix', 'day_julian', 'weekday',
       'hour']);
2024-07-04 12:02:31 : Training AutoML...
2024-07-04 12:03:31 : Best model is xgboost with best model parameters of {'n_estimators': 80, 'max_leaves': 179, 'min_child_weight': 0.03469842703470486, 'learning_rate': 0.09050333780681966, 'subsample': 0.8788794424065157, 'colsample_bylevel': 0.7372635897769984, 'colsample_bytree': 0.9535003009271207, 'reg_alpha': 0.09353166342028453, 'reg_lambda': 3.6044671382295674}
[9]:
best_model = automl.best_estimator
best_config = automl.best_config
print("Best model:", best_model)
print("Best model parameters:", best_config)
Best model: xgboost
Best model parameters: {'n_estimators': 80, 'max_leaves': 179, 'min_child_weight': 0.03469842703470486, 'learning_rate': 0.09050333780681966, 'subsample': 0.8788794424065157, 'colsample_bylevel': 0.7372635897769984, 'colsample_bytree': 0.9535003009271207, 'reg_alpha': 0.09353166342028453, 'reg_lambda': 3.6044671382295674}
[10]:
automl.best_result
[10]:
{'pred_time': 2.8282029858194133e-06,
 'wall_clock_time': 15.478726148605347,
 'metric_for_logging': {'pred_time': 2.8282029858194133e-06},
 'val_loss': 0.14506105728824534,
 'training_iteration': 1,
 'config': {'n_estimators': 80,
  'max_leaves': 179,
  'min_child_weight': 0.03469842703470486,
  'learning_rate': 0.09050333780681966,
  'subsample': 0.8788794424065157,
  'colsample_bylevel': 0.7372635897769984,
  'colsample_bytree': 0.9535003009271207,
  'reg_alpha': 0.09353166342028453,
  'reg_lambda': 3.6044671382295674},
 'config/n_estimators': 80,
 'config/max_leaves': 179,
 'config/min_child_weight': 0.03469842703470486,
 'config/learning_rate': 0.09050333780681966,
 'config/subsample': 0.8788794424065157,
 'config/colsample_bylevel': 0.7372635897769984,
 'config/colsample_bytree': 0.9535003009271207,
 'config/reg_alpha': 0.09353166342028453,
 'config/reg_lambda': 3.6044671382295674,
 'experiment_tag': 'exp',
 'time_total_s': 3.0076282024383545}
[11]:
automl.feature_importances_
[11]:
array([0.0512452 , 0.09356024, 0.05020848, 0.07993569, 0.0396647 ,
       0.21618505, 0.05815253, 0.02513707, 0.02636059, 0.03911485,
       0.02288253, 0.1130693 , 0.15781933, 0.02666452], dtype=float32)
[12]:
automl.feature_names_in_
[12]:
array(['weekday', 'u10', 'v10', 'd2m', 't2m', 'blh', 'sp', 'ssrd', 'tcc',
       'tp', 'rh2m', 'date_unix', 'day_julian', 'hour'], dtype='<U10')
[13]:
mod_stats=(pd.concat([normet.modStats(df1a,automl,set='testing'),
                normet.modStats(df1a,automl,set='training'),
                normet.modStats(df1a.assign(set="all"),automl,set='all')]))
[14]:
mod_stats
[14]:
| n | FAC2 | MB | MGE | NMB | NMGE | RMSE | r | p_level | COE | IOA | R2 | set | |
|---|---|---|---|---|---|---|---|---|---|---|---|---|---|
| 0 | 1593 | 0.912116 | 0.065145 | 1.948816 | 0.007081 | 0.211829 | 2.796755 | 0.936845 | *** | 0.645061 | 0.822530 | 0.877679 | testing |
| 0 | 4780 | 0.971967 | -0.013397 | 0.655479 | -0.001470 | 0.071933 | 0.868739 | 0.994758 | *** | 0.880270 | 0.940135 | 0.989543 | training |
| 0 | 6373 | 0.957006 | 0.006235 | 0.978762 | 0.000683 | 0.107153 | 1.587833 | 0.981282 | *** | 0.821371 | 0.910685 | 0.962915 | all |
[15]:
df1a
[15]:
| rowid | u10 | d2m | rh2m | v10 | ssrd | t2m | blh | tcc | sp | value | tp | date | date_unix | day_julian | weekday | hour | set | |
|---|---|---|---|---|---|---|---|---|---|---|---|---|---|---|---|---|---|---|
| 0 | 0 | -2.720528 | 277.183465 | 91.884130 | 1.545010 | -1.164153e-10 | 278.394725 | 384.209053 | 0.650958 | 102252.303312 | 58.1 | 0.000008 | 2020-01-01 00:00:00 | 1.577837e+09 | 1 | 3 | 0 | training |
| 1 | 1 | -2.308789 | 276.695430 | 92.715877 | 1.282742 | -1.164153e-10 | 277.772899 | 353.220263 | 0.603699 | 102211.168636 | 43.2 | 0.000002 | 2020-01-01 01:00:00 | 1.577840e+09 | 1 | 3 | 1 | training |
| 2 | 2 | -2.216471 | 276.505662 | 93.485560 | 0.758730 | -1.164153e-10 | 277.463419 | 255.911846 | 0.710378 | 102174.855967 | 43.0 | 0.000005 | 2020-01-01 02:00:00 | 1.577844e+09 | 1 | 3 | 2 | testing |
| 3 | 3 | -1.928623 | 276.412816 | 93.906363 | 0.509013 | -1.164153e-10 | 277.305813 | 191.375560 | 0.837765 | 102166.786485 | 42.8 | 0.000005 | 2020-01-01 03:00:00 | 1.577848e+09 | 1 | 3 | 3 | training |
| 4 | 4 | -1.700043 | 276.553051 | 93.696878 | 0.607069 | -1.164153e-10 | 277.478941 | 151.780210 | 0.819103 | 102142.578039 | 36.8 | 0.000003 | 2020-01-01 04:00:00 | 1.577851e+09 | 1 | 3 | 4 | testing |
| ... | ... | ... | ... | ... | ... | ... | ... | ... | ... | ... | ... | ... | ... | ... | ... | ... | ... | ... |
| 6368 | 6368 | 1.380939 | 272.197565 | 90.582979 | -1.945195 | -5.820766e-11 | 273.557442 | 476.945688 | 0.918149 | 99902.506413 | 11.7 | 0.000000 | 2020-12-31 19:00:00 | 1.609441e+09 | 366 | 4 | 19 | training |
| 6369 | 6369 | 0.987925 | 272.171041 | 89.939908 | -2.102732 | -5.820766e-11 | 273.629146 | 486.665851 | 0.839639 | 99947.625909 | 11.0 | 0.000000 | 2020-12-31 20:00:00 | 1.609445e+09 | 366 | 4 | 20 | training |
| 6370 | 6370 | 0.681543 | 272.087408 | 90.422188 | -1.933668 | -5.820766e-11 | 273.470592 | 489.355002 | 0.739354 | 100000.215520 | 15.3 | 0.000000 | 2020-12-31 21:00:00 | 1.609448e+09 | 366 | 4 | 21 | testing |
| 6371 | 6371 | 1.020793 | 272.235319 | 95.088677 | -0.583816 | -5.820766e-11 | 272.926062 | 40.714872 | 0.643753 | 100042.844978 | 17.1 | 0.000000 | 2020-12-31 22:00:00 | 1.609452e+09 | 366 | 4 | 22 | training |
| 6372 | 6372 | 0.959517 | 272.020979 | 95.290673 | -0.377511 | -5.820766e-11 | 272.681367 | 55.617254 | 0.549403 | 100053.601944 | 15.2 | 0.000000 | 2020-12-31 23:00:00 | 1.609456e+09 | 366 | 4 | 23 | training |
6373 rows × 18 columns
[16]:
start_time = time.time()
df_dew=normet.normalise(df1a, automl,
                           feature_names=['u10', 'v10', 'd2m', 't2m',
       'blh', 'sp', 'ssrd', 'tcc', 'tp', 'rh2m','date_unix', 'day_julian', 'weekday',
       'hour'],
                          variables_resample= ['u10', 'v10', 'd2m', 't2m',
       'blh', 'sp', 'ssrd', 'tcc', 'tp', 'rh2m'],
                          n_samples=1000,aggregate=True)
end_time = time.time()

# 计算执行时间
execution_time = end_time - start_time
print(f"Execution time: {execution_time:.2f} seconds")
2024-07-04 12:03:31 : Normalising the dataset using the trained model in parallel.
2024-07-04 12:03:41 : Aggregating 1000 predictions...
Execution time: 9.66 seconds
[17]:
start_time = time.time()
df_dew1=normet.normalise(df1a, automl, weather_df=df1.loc['2020-01-01':'2020-04-01',:],
                           feature_names=['u10', 'v10', 'd2m', 't2m',
       'blh', 'sp', 'ssrd', 'tcc', 'tp', 'rh2m','date_unix', 'day_julian', 'weekday',
       'hour'],
                          variables_resample= ['u10', 'v10', 'd2m', 't2m',
       'blh', 'sp', 'ssrd', 'tcc', 'tp', 'rh2m'],
                          n_samples=300,aggregate=True)
end_time = time.time()

# 计算执行时间
execution_time = end_time - start_time
print(f"Execution time: {execution_time:.2f} seconds")
2024-07-04 12:03:41 : Normalising the dataset using the trained model in parallel.
2024-07-04 12:03:44 : Aggregating 300 predictions...
Execution time: 2.67 seconds
[18]:
weather_df=df1.reset_index().iloc[0:100][['u10', 'v10', 'd2m', 't2m',
       'blh', 'sp', 'ssrd', 'tcc', 'tp', 'rh2m']]
[19]:
weather_df.head()
[19]:
| u10 | v10 | d2m | t2m | blh | sp | ssrd | tcc | tp | rh2m | |
|---|---|---|---|---|---|---|---|---|---|---|
| 0 | -2.720528 | 1.545010 | 277.183465 | 278.394725 | 384.209053 | 102252.303312 | -1.164153e-10 | 0.650958 | 0.000008 | 91.884130 |
| 1 | -2.308789 | 1.282742 | 276.695430 | 277.772899 | 353.220263 | 102211.168636 | -1.164153e-10 | 0.603699 | 0.000002 | 92.715877 |
| 2 | -2.216471 | 0.758730 | 276.505662 | 277.463419 | 255.911846 | 102174.855967 | -1.164153e-10 | 0.710378 | 0.000005 | 93.485560 |
| 3 | -1.928623 | 0.509013 | 276.412816 | 277.305813 | 191.375560 | 102166.786485 | -1.164153e-10 | 0.837765 | 0.000005 | 93.906363 |
| 4 | -1.700043 | 0.607069 | 276.553051 | 277.478941 | 151.780210 | 102142.578039 | -1.164153e-10 | 0.819103 | 0.000003 | 93.696878 |
[20]:
start_time = time.time()
df_dew2=normet.normalise(df1a, automl, weather_df=weather_df,
                           feature_names=['u10', 'v10', 'd2m', 't2m',
       'blh', 'sp', 'ssrd', 'tcc', 'tp', 'rh2m','date_unix', 'day_julian', 'weekday',
       'hour'],
                          variables_resample= ['u10', 'v10', 'd2m', 't2m',
       'blh', 'sp', 'ssrd', 'tcc', 'tp', 'rh2m'],
                          n_samples=300,aggregate=True)
end_time = time.time()

# 计算执行时间
execution_time = end_time - start_time
print(f"Execution time: {execution_time:.2f} seconds")
2024-07-04 12:03:44 : Normalising the dataset using the trained model in parallel.
2024-07-04 12:03:46 : Aggregating 300 predictions...
Execution time: 2.26 seconds
[21]:
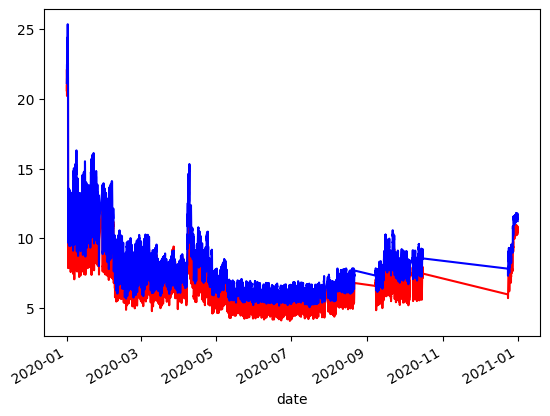
df_dew1['normalised'].plot(c='r')
df_dew2['normalised'].plot(c='b')
[21]:
<Axes: xlabel='date'>
[22]:
model_config={
    'time_budget': 60,  # Total running time in seconds
    'metric': 'r2', #
}
[23]:
df1a.columns
[23]:
Index(['rowid', 'u10', 'd2m', 'rh2m', 'v10', 'ssrd', 't2m', 'blh', 'tcc', 'sp',
       'value', 'tp', 'date', 'date_unix', 'day_julian', 'weekday', 'hour',
       'set'],
      dtype='object')
[24]:
df_dew, mod_stats=normet.do_all(df1,value='PM2.5',feature_names=['u10', 'v10', 'd2m', 't2m',
       'blh', 'sp', 'ssrd', 'tcc', 'tp', 'rh2m','date_unix', 'day_julian', 'weekday',
       'hour'],variables_resample=['u10', 'v10', 'd2m', 't2m',
       'blh', 'sp', 'ssrd', 'tcc', 'tp', 'rh2m'],model_config=model_config,n_samples=100)
2024-07-04 12:03:46 : Training AutoML...
2024-07-04 12:04:47 : Best model is xgboost with best model parameters of {'n_estimators': 80, 'max_leaves': 179, 'min_child_weight': 0.03469842703470486, 'learning_rate': 0.09050333780681966, 'subsample': 0.8788794424065157, 'colsample_bylevel': 0.7372635897769984, 'colsample_bytree': 0.9535003009271207, 'reg_alpha': 0.09353166342028453, 'reg_lambda': 3.6044671382295674}
2024-07-04 12:04:47 : Normalising the dataset using the trained model in parallel.
2024-07-04 12:04:48 : Aggregating 100 predictions...
[25]:
df_dew, mod_stats=normet.do_all(df1a,automl,feature_names=['u10', 'v10', 'd2m', 't2m',
       'blh', 'sp', 'ssrd', 'tcc', 'tp', 'rh2m','date_unix', 'day_julian', 'weekday',
       'hour'],variables_resample=['u10', 'v10', 'd2m', 't2m',
       'blh', 'sp', 'ssrd', 'tcc', 'tp', 'rh2m'],model_config=model_config,n_samples=100)
2024-07-04 12:04:48 : Normalising the dataset using the trained model in parallel.
2024-07-04 12:04:49 : Aggregating 100 predictions...
[26]:
df_dew, mod_stats=normet.do_all(df1a,automl,feature_names=['u10', 'v10', 'd2m', 't2m',
       'blh', 'sp', 'ssrd', 'tcc', 'tp', 'rh2m','date_unix', 'day_julian', 'weekday',
       'hour'],variables_resample=['u10', 'v10', 'd2m', 't2m',
       'blh', 'sp', 'ssrd', 'tcc', 'tp', 'rh2m'],weather_df=weather_df,model_config=model_config,n_samples=100)
2024-07-04 12:04:49 : Normalising the dataset using the trained model in parallel.
2024-07-04 12:04:49 : Aggregating 100 predictions...
[27]:
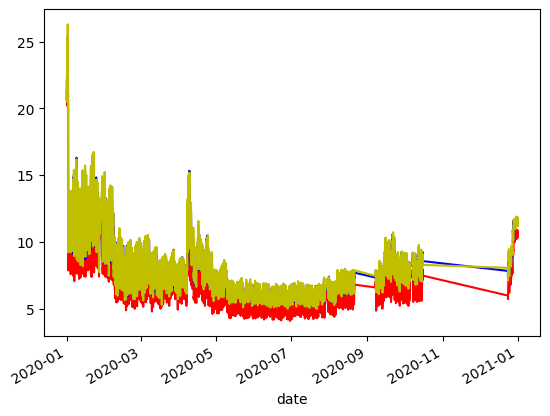
df_dew1['normalised'].plot(c='r')
df_dew2['normalised'].plot(c='b')
df_dew['normalised'].plot(c='y')
[27]:
<Axes: xlabel='date'>
[28]:
mod_stats
[28]:
| n | FAC2 | MB | MGE | NMB | NMGE | RMSE | r | p_level | COE | IOA | R2 | set | |
|---|---|---|---|---|---|---|---|---|---|---|---|---|---|
| 0 | 1593 | 0.912116 | 0.065145 | 1.948816 | 0.007081 | 0.211829 | 2.796755 | 0.936845 | *** | 0.645061 | 0.822530 | 0.877679 | testing |
| 1 | 4780 | 0.971967 | -0.013397 | 0.655479 | -0.001470 | 0.071933 | 0.868739 | 0.994758 | *** | 0.880270 | 0.940135 | 0.989543 | training |
| 2 | 6373 | 0.957006 | 0.006235 | 0.978762 | 0.000683 | 0.107153 | 1.587833 | 0.981282 | *** | 0.821371 | 0.910685 | 0.962915 | all |
[29]:
df_dew, mod_stats=normet.do_all_unc(df1,value='PM2.5',feature_names=['u10', 'v10', 'd2m', 't2m',
       'blh', 'sp', 'ssrd', 'tcc', 'tp', 'rh2m','date_unix', 'day_julian', 'weekday',
       'hour'],variables_resample=['u10', 'v10', 'd2m', 't2m',
       'blh', 'sp', 'ssrd', 'tcc', 'tp', 'rh2m'],n_samples=100,n_models=5)
2024-07-04 12:05:52 : Progress: 20.00% (Model 1/5)... ETA: 4.14 minutes
2024-07-04 12:07:11 : Progress: 40.00% (Model 2/5)... ETA: 3.54 minutes
2024-07-04 12:08:14 : Progress: 60.00% (Model 3/5)... ETA: 2.27 minutes
2024-07-04 12:09:32 : Progress: 80.00% (Model 4/5)... ETA: 1.18 minutes
2024-07-04 12:10:32 : Progress: 100.00% (Model 5/5)... ETA: 0.00 seconds
[30]:
#Resampling from given dataset
df_dew, mod_stats=normet.do_all(df1,value='PM2.5',weather_df=df1.loc['2020-01-01':'2020-04-01',:],feature_names=['u10', 'v10', 'd2m', 't2m',
       'blh', 'sp', 'ssrd', 'tcc', 'tp', 'rh2m','date_unix', 'day_julian', 'weekday',
       'hour'],variables_resample=['u10', 'v10', 'd2m', 't2m',
       'blh', 'sp', 'ssrd', 'tcc', 'tp', 'rh2m'],model_config=model_config,n_samples=300)
2024-07-04 12:10:32 : Training AutoML...
2024-07-04 12:11:33 : Best model is xgboost with best model parameters of {'n_estimators': 80, 'max_leaves': 179, 'min_child_weight': 0.03469842703470486, 'learning_rate': 0.09050333780681966, 'subsample': 0.8788794424065157, 'colsample_bylevel': 0.7372635897769984, 'colsample_bytree': 0.9535003009271207, 'reg_alpha': 0.09353166342028453, 'reg_lambda': 3.6044671382295674}
2024-07-04 12:11:33 : Normalising the dataset using the trained model in parallel.
2024-07-04 12:11:36 : Aggregating 300 predictions...
[31]:
df_dew.head()
[31]:
| observed | normalised | |
|---|---|---|
| date | ||
| 2020-01-01 00:00:00 | 58.1 | 22.036427 |
| 2020-01-01 01:00:00 | 43.2 | 20.604290 |
| 2020-01-01 02:00:00 | 43.0 | 20.541487 |
| 2020-01-01 03:00:00 | 42.8 | 20.982031 |
| 2020-01-01 04:00:00 | 36.8 | 20.209471 |
Time series decomposition
[32]:
df_dewca, mod_stats=normet.decom_emi(df1, value='PM2.5',feature_names=['u10', 'v10', 'd2m', 't2m',
       'blh', 'sp', 'ssrd', 'tcc', 'tp', 'rh2m','date_unix', 'day_julian', 'weekday',
       'hour'], split_method = 'random', fraction=0.75, n_samples=300)
2024-07-04 12:11:36 : Training AutoML...
2024-07-04 12:12:36 : Best model is xgboost with best model parameters of {'n_estimators': 80, 'max_leaves': 179, 'min_child_weight': 0.03469842703470486, 'learning_rate': 0.09050333780681966, 'subsample': 0.8788794424065157, 'colsample_bylevel': 0.7372635897769984, 'colsample_bytree': 0.9535003009271207, 'reg_alpha': 0.09353166342028453, 'reg_lambda': 3.6044671382295674}
2024-07-04 12:12:36 : Subtracting base...
2024-07-04 12:12:39 : Subtracting date_unix... ETA: 11.40 seconds
2024-07-04 12:12:42 : Subtracting day_julian... ETA: 8.19 seconds
2024-07-04 12:12:45 : Subtracting weekday... ETA: 5.41 seconds
2024-07-04 12:12:47 : Subtracting hour... ETA: 2.68 seconds
[33]:
df_dewca
[33]:
| observed | base | date_unix | day_julian | weekday | hour | deweathered | emi_noise | |
|---|---|---|---|---|---|---|---|---|
| date | ||||||||
| 2020-01-01 00:00:00 | 58.1 | 9.818041 | 20.604118 | 1.449459 | 0.553579 | -0.750149 | 22.521753 | 0.664746 |
| 2020-01-01 01:00:00 | 43.2 | 9.692105 | 21.145397 | 1.942423 | 0.545198 | -0.448908 | 23.722921 | 0.538811 |
| 2020-01-01 02:00:00 | 43.0 | 8.911392 | 21.416718 | 1.732838 | 0.660833 | -0.588243 | 22.980244 | -0.241902 |
| 2020-01-01 03:00:00 | 42.8 | 8.811673 | 21.317305 | 1.873583 | 0.566668 | -0.807030 | 22.608904 | -0.341621 |
| 2020-01-01 04:00:00 | 36.8 | 8.689767 | 21.724403 | 1.793306 | 0.571714 | -0.710558 | 22.915339 | -0.463528 |
| ... | ... | ... | ... | ... | ... | ... | ... | ... |
| 2020-12-31 19:00:00 | 11.7 | 8.585531 | 11.187433 | 1.018248 | 0.065087 | 0.030320 | 11.733325 | -0.567763 |
| 2020-12-31 20:00:00 | 11.0 | 10.310694 | 9.855659 | 0.788847 | 0.049502 | -0.077022 | 11.774386 | 1.157399 |
| 2020-12-31 21:00:00 | 15.3 | 8.988753 | 10.415834 | 1.015028 | 0.096924 | -0.112138 | 11.251107 | -0.164541 |
| 2020-12-31 22:00:00 | 17.1 | 9.330045 | 10.346726 | 0.955586 | 0.104383 | -0.266882 | 11.316565 | 0.176750 |
| 2020-12-31 23:00:00 | 15.2 | 9.275574 | 10.362161 | 0.748316 | 0.091792 | -0.295992 | 11.028556 | 0.122279 |
6373 rows × 8 columns
[34]:
df_dewca, mod_stats=normet.decom_emi(df1a, model=automl,feature_names=['u10', 'v10', 'd2m', 't2m',
       'blh', 'sp', 'ssrd', 'tcc', 'tp', 'rh2m','date_unix', 'day_julian', 'weekday',
       'hour'], n_samples=300)
2024-07-04 12:12:50 : Subtracting base...
2024-07-04 12:12:52 : Subtracting date_unix... ETA: 10.73 seconds
2024-07-04 12:12:55 : Subtracting day_julian... ETA: 7.97 seconds
2024-07-04 12:12:58 : Subtracting weekday... ETA: 5.31 seconds
2024-07-04 12:13:00 : Subtracting hour... ETA: 2.64 seconds
[35]:
df_dewcb, mod_stats=normet.decom_met(df1, value='PM2.5',feature_names=['u10', 'v10', 'd2m', 't2m',
       'blh', 'sp', 'ssrd', 'tcc', 'tp', 'rh2m','date_unix', 'day_julian', 'weekday',
       'hour'], n_samples=300,fraction=0.75, seed=7654321)
2024-07-04 12:13:03 : Training AutoML...
2024-07-04 12:14:03 : Best model is xgboost with best model parameters of {'n_estimators': 80, 'max_leaves': 179, 'min_child_weight': 0.03469842703470486, 'learning_rate': 0.09050333780681966, 'subsample': 0.8788794424065157, 'colsample_bylevel': 0.7372635897769984, 'colsample_bytree': 0.9535003009271207, 'reg_alpha': 0.09353166342028453, 'reg_lambda': 3.6044671382295674}
2024-07-04 12:14:04 : Subtracting deweathered...
2024-07-04 12:14:06 : Subtracting blh... ETA: 26.09 seconds
2024-07-04 12:14:09 : Subtracting u10... ETA: 23.09 seconds
2024-07-04 12:14:11 : Subtracting d2m... ETA: 20.13 seconds
2024-07-04 12:14:13 : Subtracting sp... ETA: 17.28 seconds
2024-07-04 12:14:16 : Subtracting v10... ETA: 14.58 seconds
2024-07-04 12:14:18 : Subtracting t2m... ETA: 11.93 seconds
2024-07-04 12:14:20 : Subtracting tp... ETA: 9.41 seconds
2024-07-04 12:14:22 : Subtracting tcc... ETA: 6.94 seconds
2024-07-04 12:14:24 : Subtracting ssrd... ETA: 4.55 seconds
2024-07-04 12:14:26 : Subtracting rh2m... ETA: 2.24 seconds
[36]:
df_dewcb, mod_stats=normet.decom_met(df1a, model=automl, feature_names=['u10', 'v10', 'd2m', 't2m',
       'blh', 'sp', 'ssrd', 'tcc', 'tp', 'rh2m','date_unix', 'day_julian', 'weekday',
       'hour'], n_samples=300,fraction=0.75, seed=7654321)
2024-07-04 12:14:28 : Subtracting deweathered...
2024-07-04 12:14:30 : Subtracting blh... ETA: 26.35 seconds
2024-07-04 12:14:33 : Subtracting u10... ETA: 22.99 seconds
2024-07-04 12:14:35 : Subtracting d2m... ETA: 20.03 seconds
2024-07-04 12:14:38 : Subtracting sp... ETA: 17.18 seconds
2024-07-04 12:14:40 : Subtracting v10... ETA: 14.50 seconds
2024-07-04 12:14:42 : Subtracting t2m... ETA: 11.98 seconds
2024-07-04 12:14:44 : Subtracting tp... ETA: 9.42 seconds
2024-07-04 12:14:46 : Subtracting tcc... ETA: 6.97 seconds
2024-07-04 12:14:48 : Subtracting ssrd... ETA: 4.57 seconds
2024-07-04 12:14:50 : Subtracting rh2m... ETA: 2.25 seconds
[37]:
df_dewcb
[37]:
| observed | deweathered | blh | u10 | d2m | sp | v10 | t2m | tp | tcc | ssrd | rh2m | met_noise | |
|---|---|---|---|---|---|---|---|---|---|---|---|---|---|
| date | |||||||||||||
| 2020-01-01 00:00:00 | 58.1 | 22.521753 | 3.105356 | 15.690435 | 13.370102 | 3.032124 | 6.203915 | 5.311699 | 2.730858 | 1.852100 | 0.520401 | 0.291279 | 9.400610 |
| 2020-01-01 01:00:00 | 43.2 | 23.722921 | 1.032499 | 10.332563 | 10.146141 | 3.130753 | 5.301819 | 4.798836 | 2.912220 | 2.052608 | 1.157616 | -0.196972 | -0.640710 |
| 2020-01-01 02:00:00 | 43.0 | 22.980244 | 0.215631 | 6.851231 | 8.113451 | 3.094269 | 4.130383 | 4.713776 | 3.276894 | 2.710617 | 2.732285 | 1.285332 | 1.364532 |
| 2020-01-01 03:00:00 | 42.8 | 22.608904 | -0.558086 | 5.456263 | 8.559235 | 3.648994 | 3.184381 | 4.667519 | 3.397984 | 2.791050 | 3.348179 | 1.633690 | 1.993581 |
| 2020-01-01 04:00:00 | 36.8 | 22.915339 | -0.296980 | 1.798401 | 4.787289 | 3.438236 | 1.801090 | 3.431309 | 2.871231 | 1.892057 | 2.969601 | 2.141823 | 1.182835 |
| ... | ... | ... | ... | ... | ... | ... | ... | ... | ... | ... | ... | ... | ... |
| 2020-12-31 19:00:00 | 11.7 | 11.733325 | -0.629538 | -0.715612 | -0.015411 | 0.308806 | 0.392364 | 0.891096 | 0.799346 | -0.003299 | -0.062504 | -0.241484 | -0.272833 |
| 2020-12-31 20:00:00 | 11.0 | 11.774386 | -0.537662 | -0.538769 | -0.091031 | 0.148932 | 0.305520 | 0.786525 | 0.761405 | -0.405293 | -0.437243 | -0.193840 | -0.571940 |
| 2020-12-31 21:00:00 | 15.3 | 11.251107 | -0.243903 | -0.258332 | 0.046582 | 0.338228 | 0.362024 | 0.831674 | 0.803146 | -0.466408 | -0.422866 | -0.049072 | 3.652803 |
| 2020-12-31 22:00:00 | 17.1 | 11.316565 | 4.063190 | 2.834073 | -1.142671 | 2.329886 | 2.193111 | -0.082521 | 0.252815 | 0.015556 | -0.009989 | 0.315748 | 0.370693 |
| 2020-12-31 23:00:00 | 15.2 | 11.028556 | 4.984342 | 2.931353 | -2.154545 | 2.283448 | 2.286663 | -0.245660 | 0.163794 | 0.237981 | 0.146729 | -0.258326 | -0.777352 |
6373 rows × 13 columns
[38]:
df_dewca, mod_stats=normet.decom_emi(df1a, model=automl,feature_names=['u10', 'v10', 'd2m', 't2m',
       'blh', 'sp', 'ssrd', 'tcc', 'tp', 'rh2m','date_unix', 'day_julian', 'weekday',
       'hour'], n_samples=300)
2024-07-04 12:14:52 : Subtracting base...
2024-07-04 12:14:55 : Subtracting date_unix... ETA: 10.64 seconds
2024-07-04 12:14:57 : Subtracting day_julian... ETA: 8.06 seconds
2024-07-04 12:15:00 : Subtracting weekday... ETA: 5.31 seconds
2024-07-04 12:15:03 : Subtracting hour... ETA: 2.64 seconds
[39]:
df_dewca
[39]:
| observed | base | date_unix | day_julian | weekday | hour | deweathered | emi_noise | |
|---|---|---|---|---|---|---|---|---|
| date | ||||||||
| 2020-01-01 00:00:00 | 58.1 | 9.635087 | 20.808069 | 1.449459 | 0.553579 | -0.750149 | 22.521753 | 0.460794 |
| 2020-01-01 01:00:00 | 43.2 | 9.427952 | 21.430550 | 1.942423 | 0.545198 | -0.448908 | 23.722921 | 0.253659 |
| 2020-01-01 02:00:00 | 43.0 | 9.077608 | 21.271500 | 1.732838 | 0.660833 | -0.588243 | 22.980244 | -0.096684 |
| 2020-01-01 03:00:00 | 42.8 | 8.548481 | 21.601494 | 1.873583 | 0.566668 | -0.807030 | 22.608904 | -0.625812 |
| 2020-01-01 04:00:00 | 36.8 | 8.893300 | 21.541868 | 1.793306 | 0.571714 | -0.710558 | 22.915339 | -0.280993 |
| ... | ... | ... | ... | ... | ... | ... | ... | ... |
| 2020-12-31 19:00:00 | 11.7 | 9.192358 | 10.601604 | 1.018248 | 0.065087 | 0.030320 | 11.733325 | 0.018065 |
| 2020-12-31 20:00:00 | 11.0 | 9.905566 | 10.281785 | 0.788847 | 0.049502 | -0.077022 | 11.774386 | 0.731274 |
| 2020-12-31 21:00:00 | 15.3 | 8.519252 | 10.906334 | 1.015028 | 0.096924 | -0.112138 | 11.251107 | -0.655041 |
| 2020-12-31 22:00:00 | 17.1 | 8.960856 | 10.736913 | 0.955586 | 0.104383 | -0.266882 | 11.316565 | -0.213436 |
| 2020-12-31 23:00:00 | 15.2 | 9.216323 | 10.442410 | 0.748316 | 0.091792 | -0.295992 | 11.028556 | 0.042030 |
6373 rows × 8 columns
Rolling weather normalisation
[40]:
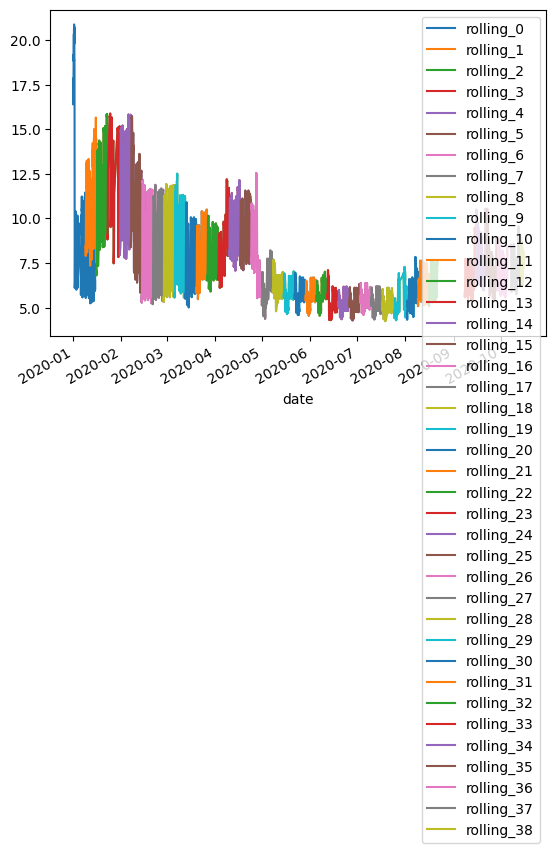
df_dewc1, mod_stats=normet.rolling_dew(df1a, automl,feature_names=['u10', 'v10', 'd2m', 't2m',
       'blh', 'sp', 'ssrd', 'tcc', 'tp', 'rh2m','date_unix', 'day_julian', 'weekday',
       'hour'],variables_resample=['u10', 'v10', 'd2m', 't2m',
       'blh', 'sp', 'ssrd', 'tcc', 'tp', 'rh2m'], n_samples=100,window_days=14, rollingevery=7)
2024-07-04 12:15:06 : Rolling window 0 from 2020-01-01 to 2020-01-15
2024-07-04 12:15:08 : Rolling window 10 from 2020-03-13 to 2020-03-27 ETA: 7.84 seconds
2024-07-04 12:15:11 : Rolling window 20 from 2020-05-22 to 2020-06-05 ETA: 5.14 seconds
2024-07-04 12:15:14 : Rolling window 30 from 2020-08-02 to 2020-08-16 ETA: 2.45 seconds
[41]:
df_dewc1.head()
[41]:
| observed | rolling_0 | rolling_1 | rolling_2 | rolling_3 | rolling_4 | rolling_5 | rolling_6 | rolling_7 | rolling_8 | ... | rolling_29 | rolling_30 | rolling_31 | rolling_32 | rolling_33 | rolling_34 | rolling_35 | rolling_36 | rolling_37 | rolling_38 | |
|---|---|---|---|---|---|---|---|---|---|---|---|---|---|---|---|---|---|---|---|---|---|
| date | |||||||||||||||||||||
| 2020-01-01 00:00:00 | 58.1 | 16.412506 | NaN | NaN | NaN | NaN | NaN | NaN | NaN | NaN | ... | NaN | NaN | NaN | NaN | NaN | NaN | NaN | NaN | NaN | NaN |
| 2020-01-01 01:00:00 | 43.2 | 17.619698 | NaN | NaN | NaN | NaN | NaN | NaN | NaN | NaN | ... | NaN | NaN | NaN | NaN | NaN | NaN | NaN | NaN | NaN | NaN |
| 2020-01-01 02:00:00 | 43.0 | 16.589432 | NaN | NaN | NaN | NaN | NaN | NaN | NaN | NaN | ... | NaN | NaN | NaN | NaN | NaN | NaN | NaN | NaN | NaN | NaN |
| 2020-01-01 03:00:00 | 42.8 | 16.524757 | NaN | NaN | NaN | NaN | NaN | NaN | NaN | NaN | ... | NaN | NaN | NaN | NaN | NaN | NaN | NaN | NaN | NaN | NaN |
| 2020-01-01 04:00:00 | 36.8 | 17.865799 | NaN | NaN | NaN | NaN | NaN | NaN | NaN | NaN | ... | NaN | NaN | NaN | NaN | NaN | NaN | NaN | NaN | NaN | NaN |
5 rows × 40 columns
[42]:
df_dewc1.iloc[:,1:].plot()
[42]:
<Axes: xlabel='date'>
[43]:
df_dewc2, mod_stats=normet.rolling_met(df1a, automl,feature_names=['u10', 'v10', 'd2m', 't2m',
       'blh', 'sp', 'ssrd', 'tcc', 'tp', 'rh2m','date_unix', 'day_julian', 'weekday',
       'hour'], n_samples=100,window_days=14,rollingevery=7,fraction=0.75, seed=7654321)
2024-07-04 12:15:18 : Rolling window 0 from 2020-01-01 to 2020-01-15
2024-07-04 12:15:21 : Rolling window 10 from 2020-03-13 to 2020-03-27 ETA: 7.85 seconds
2024-07-04 12:15:23 : Rolling window 20 from 2020-05-22 to 2020-06-05 ETA: 5.16 seconds
2024-07-04 12:15:26 : Rolling window 30 from 2020-08-02 to 2020-08-16 ETA: 2.46 seconds
[44]:
df_dewc2.head()
[44]:
| observed | normalised | emi_mean_14 | emi_std_14 | met_short | met_season | |
|---|---|---|---|---|---|---|
| date | ||||||
| 2020-01-01 00:00:00 | 58.1 | 22.331083 | NaN | NaN | NaN | NaN |
| 2020-01-01 01:00:00 | 43.2 | 23.972191 | NaN | NaN | NaN | NaN |
| 2020-01-01 02:00:00 | 43.0 | 22.342634 | NaN | NaN | NaN | NaN |
| 2020-01-01 03:00:00 | 42.8 | 22.705828 | NaN | NaN | NaN | NaN |
| 2020-01-01 04:00:00 | 36.8 | 22.325943 | NaN | NaN | NaN | NaN |
[45]:
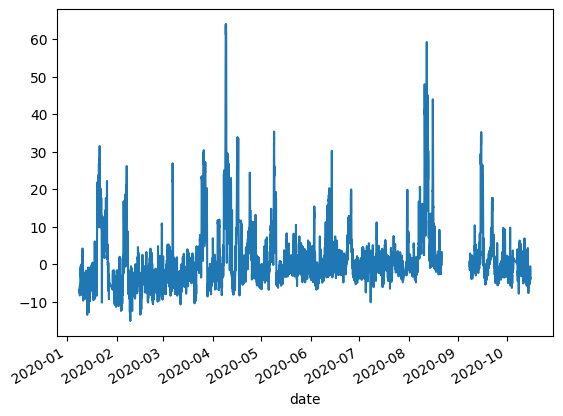
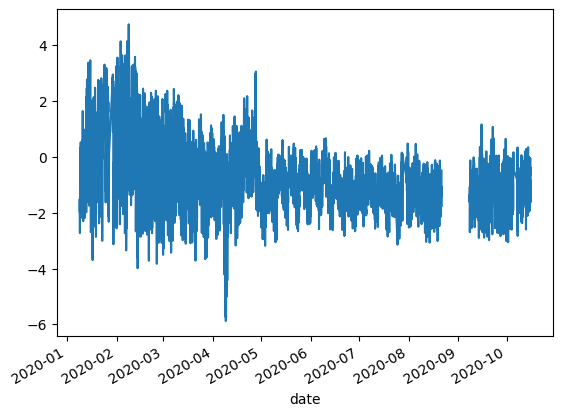
df_dewc2['met_short'].plot()
[45]:
<Axes: xlabel='date'>
[46]:
df_dewc2['met_season'].plot()
[46]:
<Axes: xlabel='date'>
Partial Dependence Plots
[47]:
df1a=normet.prepare_data(df1, value='PM2.5', feature_names=['u10', 'v10', 'd2m', 't2m',
       'blh', 'sp', 'ssrd', 'tcc', 'tp', 'rh2m'], split_method='random',  fraction=0.75, seed=7654321)
[48]:
df1a
[48]:
| rowid | u10 | d2m | rh2m | v10 | ssrd | t2m | blh | tcc | sp | value | tp | date | date_unix | day_julian | weekday | hour | set | |
|---|---|---|---|---|---|---|---|---|---|---|---|---|---|---|---|---|---|---|
| 0 | 0 | -2.720528 | 277.183465 | 91.884130 | 1.545010 | -1.164153e-10 | 278.394725 | 384.209053 | 0.650958 | 102252.303312 | 58.1 | 0.000008 | 2020-01-01 00:00:00 | 1.577837e+09 | 1 | 3 | 0 | training |
| 1 | 1 | -2.308789 | 276.695430 | 92.715877 | 1.282742 | -1.164153e-10 | 277.772899 | 353.220263 | 0.603699 | 102211.168636 | 43.2 | 0.000002 | 2020-01-01 01:00:00 | 1.577840e+09 | 1 | 3 | 1 | training |
| 2 | 2 | -2.216471 | 276.505662 | 93.485560 | 0.758730 | -1.164153e-10 | 277.463419 | 255.911846 | 0.710378 | 102174.855967 | 43.0 | 0.000005 | 2020-01-01 02:00:00 | 1.577844e+09 | 1 | 3 | 2 | testing |
| 3 | 3 | -1.928623 | 276.412816 | 93.906363 | 0.509013 | -1.164153e-10 | 277.305813 | 191.375560 | 0.837765 | 102166.786485 | 42.8 | 0.000005 | 2020-01-01 03:00:00 | 1.577848e+09 | 1 | 3 | 3 | training |
| 4 | 4 | -1.700043 | 276.553051 | 93.696878 | 0.607069 | -1.164153e-10 | 277.478941 | 151.780210 | 0.819103 | 102142.578039 | 36.8 | 0.000003 | 2020-01-01 04:00:00 | 1.577851e+09 | 1 | 3 | 4 | testing |
| ... | ... | ... | ... | ... | ... | ... | ... | ... | ... | ... | ... | ... | ... | ... | ... | ... | ... | ... |
| 6368 | 6368 | 1.380939 | 272.197565 | 90.582979 | -1.945195 | -5.820766e-11 | 273.557442 | 476.945688 | 0.918149 | 99902.506413 | 11.7 | 0.000000 | 2020-12-31 19:00:00 | 1.609441e+09 | 366 | 4 | 19 | training |
| 6369 | 6369 | 0.987925 | 272.171041 | 89.939908 | -2.102732 | -5.820766e-11 | 273.629146 | 486.665851 | 0.839639 | 99947.625909 | 11.0 | 0.000000 | 2020-12-31 20:00:00 | 1.609445e+09 | 366 | 4 | 20 | training |
| 6370 | 6370 | 0.681543 | 272.087408 | 90.422188 | -1.933668 | -5.820766e-11 | 273.470592 | 489.355002 | 0.739354 | 100000.215520 | 15.3 | 0.000000 | 2020-12-31 21:00:00 | 1.609448e+09 | 366 | 4 | 21 | testing |
| 6371 | 6371 | 1.020793 | 272.235319 | 95.088677 | -0.583816 | -5.820766e-11 | 272.926062 | 40.714872 | 0.643753 | 100042.844978 | 17.1 | 0.000000 | 2020-12-31 22:00:00 | 1.609452e+09 | 366 | 4 | 22 | training |
| 6372 | 6372 | 0.959517 | 272.020979 | 95.290673 | -0.377511 | -5.820766e-11 | 272.681367 | 55.617254 | 0.549403 | 100053.601944 | 15.2 | 0.000000 | 2020-12-31 23:00:00 | 1.609456e+09 | 366 | 4 | 23 | training |
6373 rows × 18 columns
[49]:
all_features=['u10', 'v10', 'd2m', 't2m',
       'blh', 'sp', 'ssrd', 'tcc', 'tp', 'rh2m','date_unix', 'day_julian', 'weekday',
       'hour']
pdp_value=normet.pdp_all(automl,df1a,feature_names=all_features)
[50]:
pdp_value
[50]:
| variable | value | pdp_mean | pdp_std | |
|---|---|---|---|---|
| 0 | u10 | -4.354032 | 10.963994 | 7.261466 |
| 1 | u10 | -4.242993 | 11.043289 | 7.309947 |
| 2 | u10 | -4.131954 | 11.042447 | 7.333392 |
| 3 | u10 | -4.020915 | 11.031183 | 7.338155 |
| 4 | u10 | -3.909875 | 11.040386 | 7.363017 |
| ... | ... | ... | ... | ... |
| 1226 | hour | 19.000000 | 9.639515 | 7.460504 |
| 1227 | hour | 20.000000 | 9.578510 | 7.448645 |
| 1228 | hour | 21.000000 | 9.388046 | 7.372877 |
| 1229 | hour | 22.000000 | 9.182877 | 7.346088 |
| 1230 | hour | 23.000000 | 8.964516 | 7.354586 |
1231 rows × 4 columns
[ ]: